RegressRangers
Problem Statement
Many real-world phenomena exhibit significant spatial variability, and traditional regression models that assume spatial homogeneity fail to capture the underlying patterns in the data set collected. Geographically weighted regression models are an effective way to address this problem by allowing for local variation in the relationship between the response variable and the predictor variables. However, creating accurate geographically weighted regression models can be a complex and time-consuming process that requires specialized knowledge and software. Additionally, evaluating the performance of these models can be challenging due to the local nature of the models.
Case Study
Analysing vaccination rates is crucial in the current climate as the world is grappling with a global pandemic caused by COVID-19. Vaccination 💉 is one of the most effective ways to prevent the spread of infectious diseases and protect communities from illness and death. With the availability of COVID-19 vaccination data, we can gain important insights into the progress of immunization campaigns and help identify areas where more resources and efforts are needed to increase vaccine uptake. Additionally, analyzing vaccination rates can inform public health policies and interventions aimed at improving vaccine distribution, accessibility, and equity, particularly for vulnerable populations who may face barriers to vaccination.
We will be using the above-mentioned case study to design and test our geospatial analytics tool 😃
Key Objectives
Our project aims to create a web-based geospatial analytics tool that helps users create and evaluate geographical regression models easily by:
importing data 📁
identifying significant regressors in the model 🔍
creating customised Linear and Geographically Weighted Models 📈
understanding the models based on a variety of statistical results🧪
To build and test our application, we will be modeling the vaccination rate of DKI, Jakarta in the various sub-districts based on a variety of socio-economic factors.
| Name | Source |
|---|---|
| 2019 DKI Jakarta Census data | DKI Jakarta Census Data |
| COVID-19 cases data in DKI Jakarta | District based COVID-19 data |
| Vaccination Rate data in DKI Jakarta | District based Vaccination data |
We have identified studies that have attempted to perform similar types of analyses:
1. Spatial Modeling of COVID-19 Vaccine Hesitancy in the United States
| Objective | This study examines the spatial distribution of vaccination rates in the United States and identifies significant covariates using multiscale geographically weighted regression, which can be used as a reference for region-specific policies in monitoring vaccination programs. |
| Methodology |
|
| Key Learning Points |
|
| Areas for Improvement |
|
2. Application of geographically-weighted regression analysis to assess risk factors for malaria hotspots in Keur Soce health and demographic surveillance site
| Objective | This study investigated malaria hotspots in Keur Soce sites by using geographically-weighted regression. Because of the occurrence of hotspots, spatial modelling of malaria cases could have a considerable effect in disease surveillance. |
| Methodology |
|
| Key Learning Points |
|
| Areas for Improvement |
|
3. A geographically weighted regression approach to investigate the effect of traffic conditions and road characteristics on air pollutant emissions
| Objective |
|
| Methodology |
|
| Key Learning Points |
|
| Areas for Improvement |
|
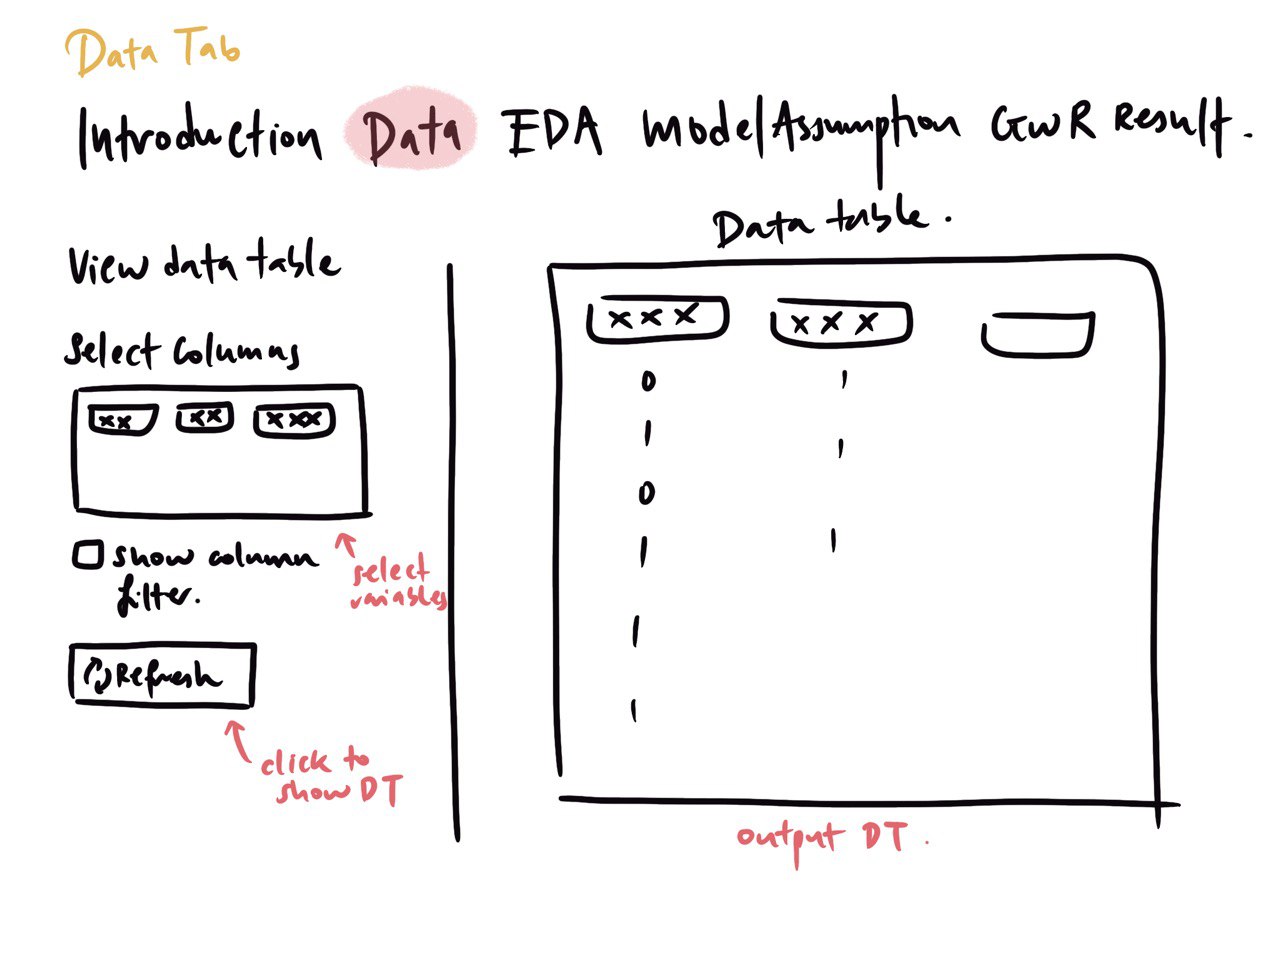
- Data Visualisation
Import data into R environment
Show data in tabular format
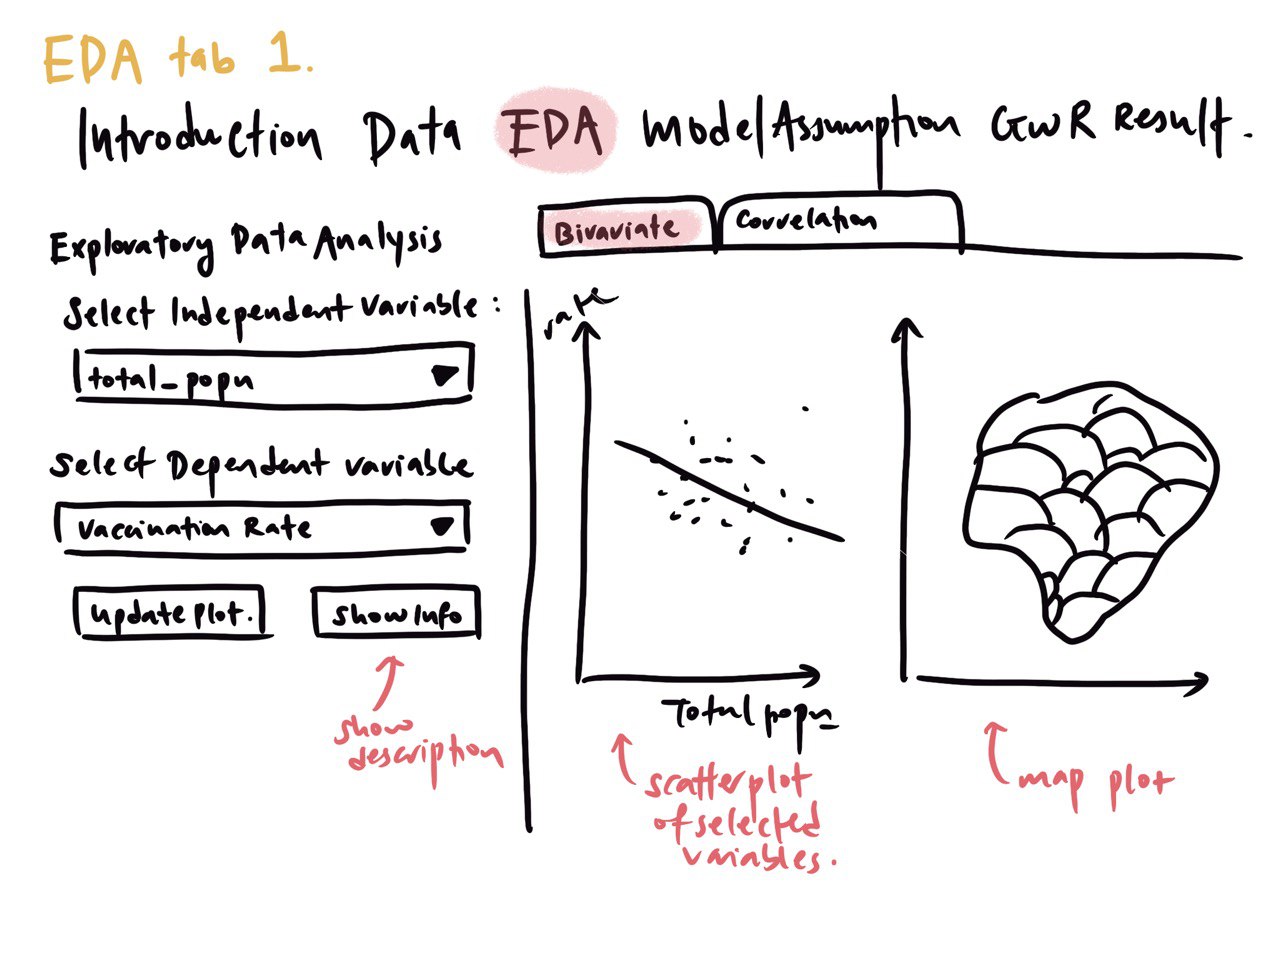
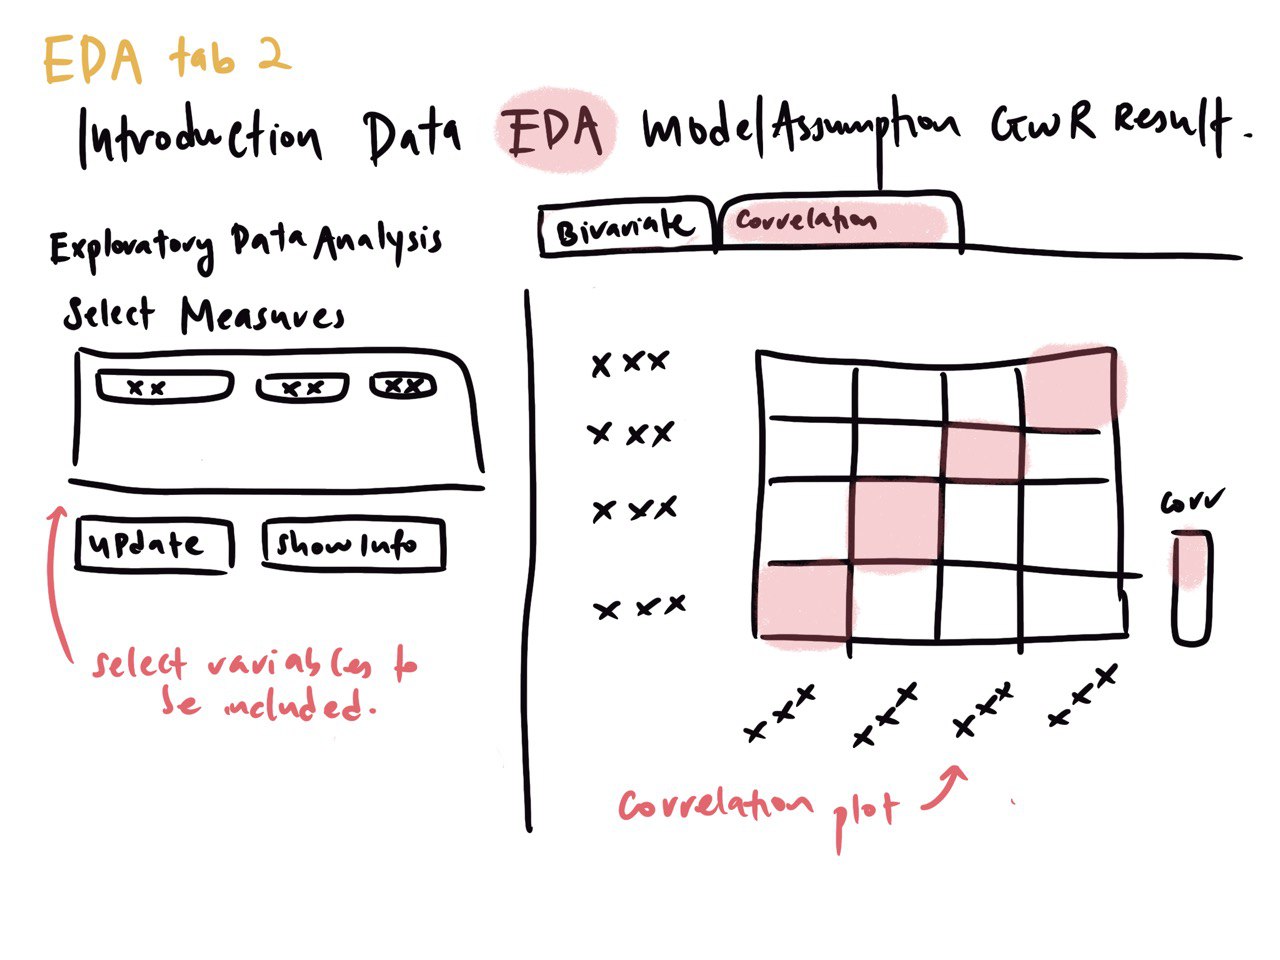
- Exploratory Data Analysis (EDA)
EDA helps users to understand the data distribution, detect outliers, and identify any missing values. This helps us evaluate the that the assumptions of statistical tests are met before performing them. EDA also helps users generate hypotheses that can guide further investigations of the issue at hand.Draw Histograms
Create Choropleth Map
Correlation Plot
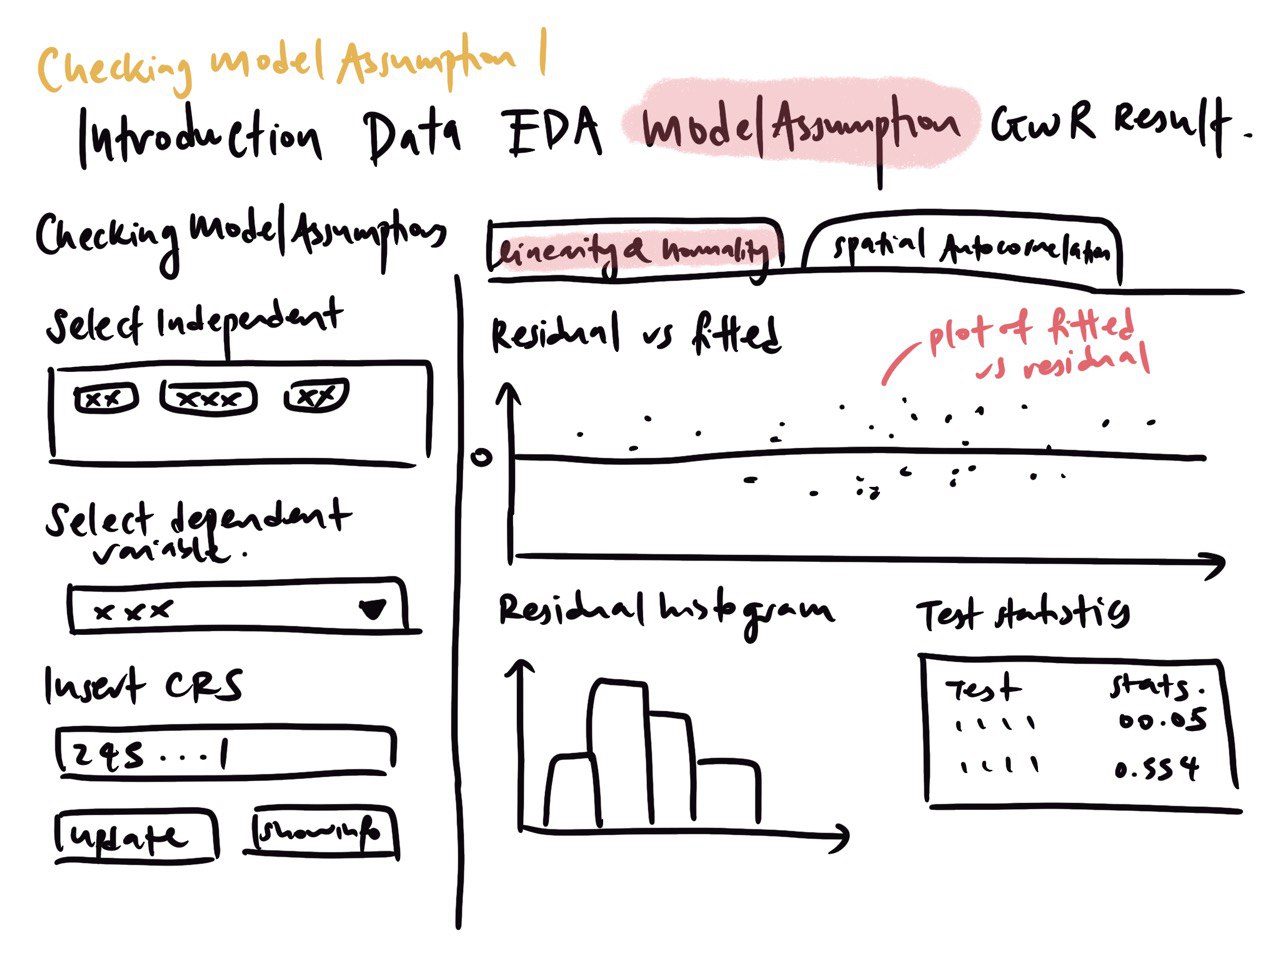
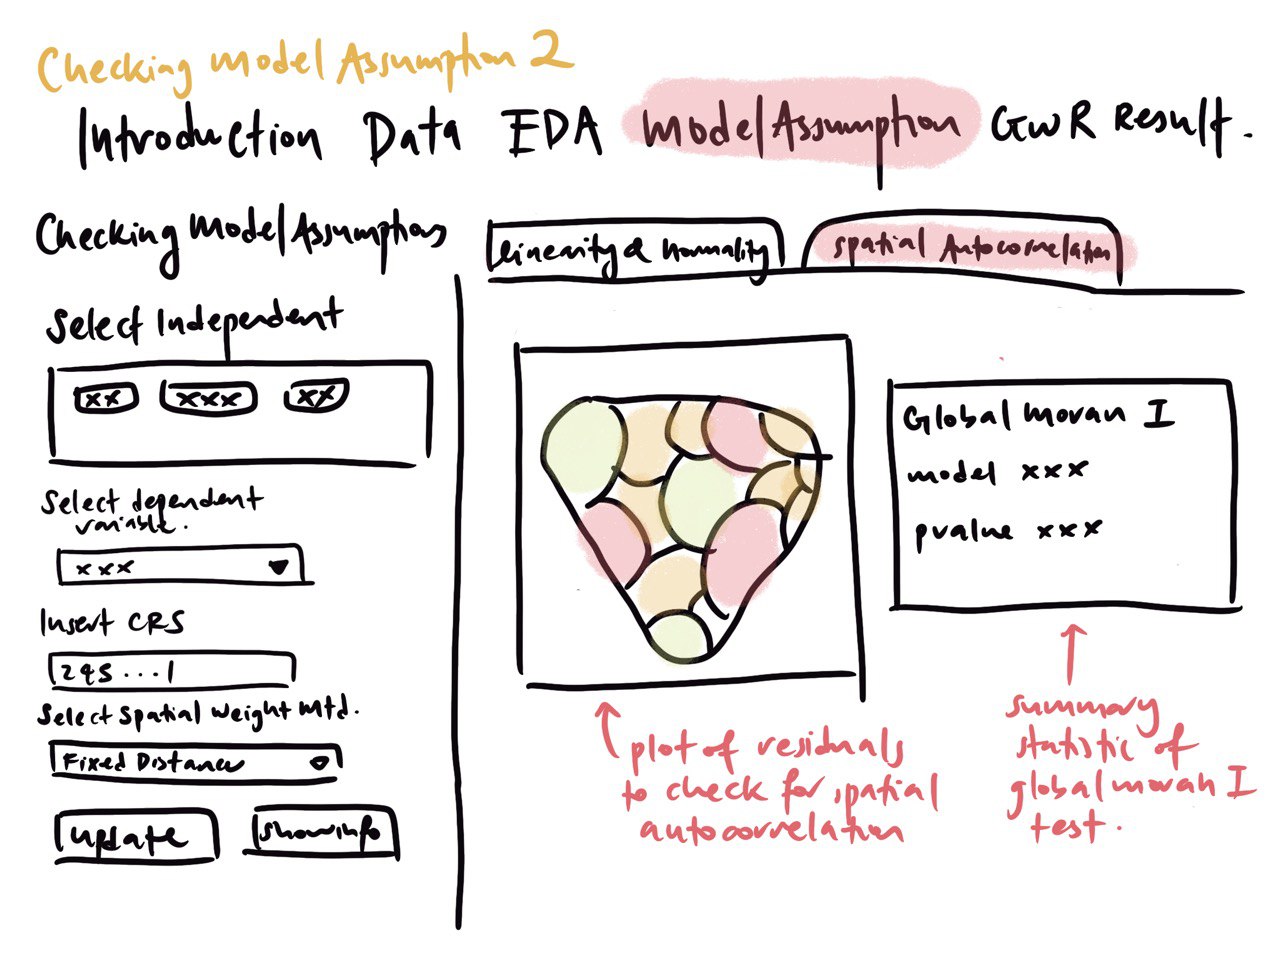
- Linear Regression (OLS)
Performing Ordinary Least Squares regression before GWR is important as it provides a globel model for the data. It can help identify overall trends and relationships in the data. By comparing the results of OLS and GWR, users can better understand how relationship between variables vary across space and make more informed decisions.Generalised Multiple Linear Regression Method
Residual Plot
Check for spatial autocollinearity
Check linearity and normality assumptions
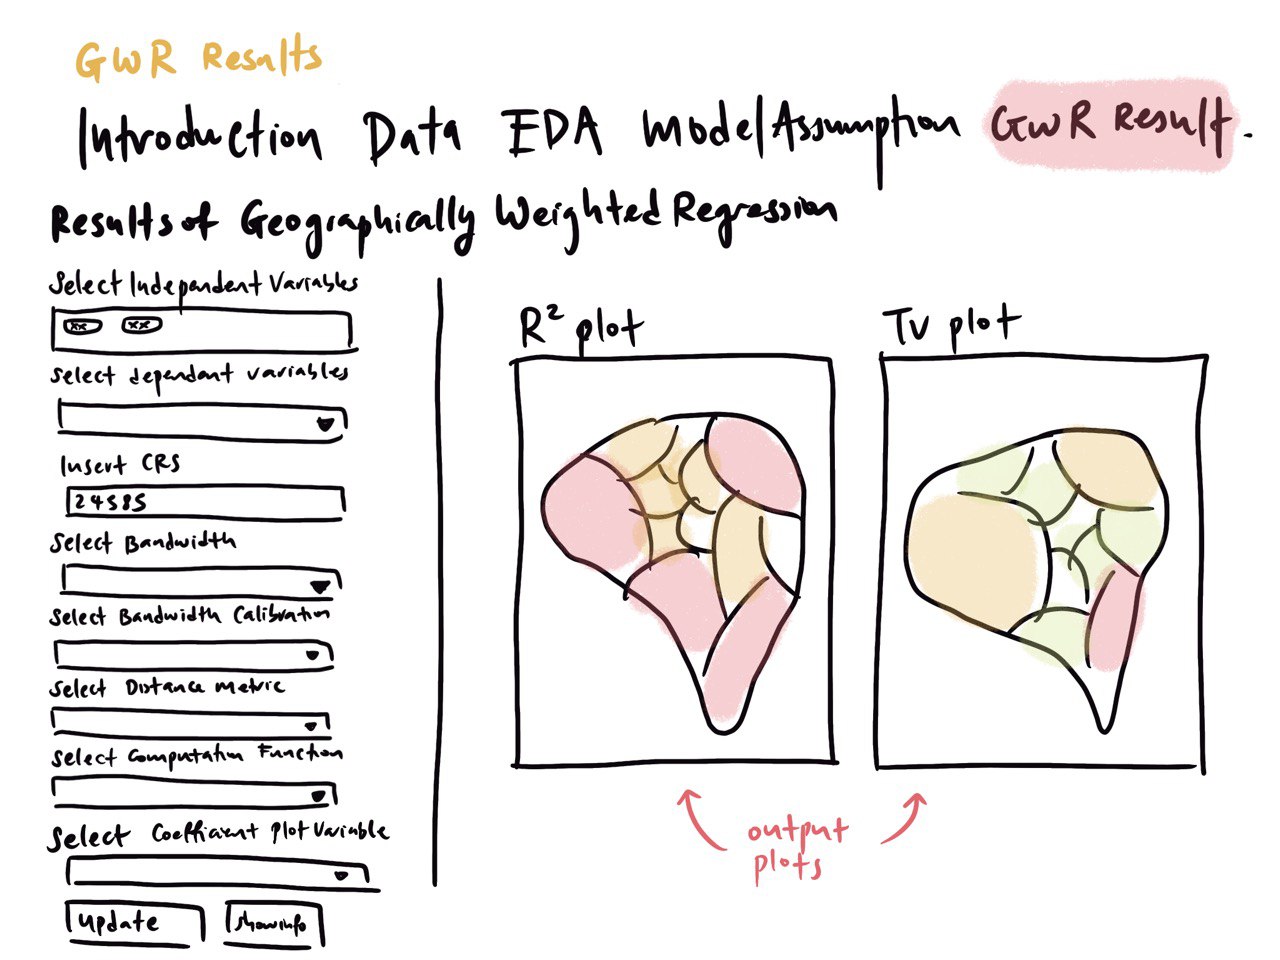
- Geographically Weighted Regression (GWR)
As mentioned in our Problem Statement, GWR helps users determine significant covariates because it allows for the estimation of local regression coefficients that could vary spatially but not revealed in a global model (such as OLS)- R2 Plot
- Coefficient t-value plot
This list is not exhaustive and we might add more libraries as we design and test the analytics tool.
sf - import geospatial data using approproate function(s)
readr - import csv files
dplyr - to perform relation joins
spdep - for computation of spatial weights and calculate spatially lagged variables
tmap - for plotting cartographic quality static point pattern maps or interactive maps using leaflet API
tidyverse - this is a collection of packages for performing data science tasks such as wrangling and visualising data
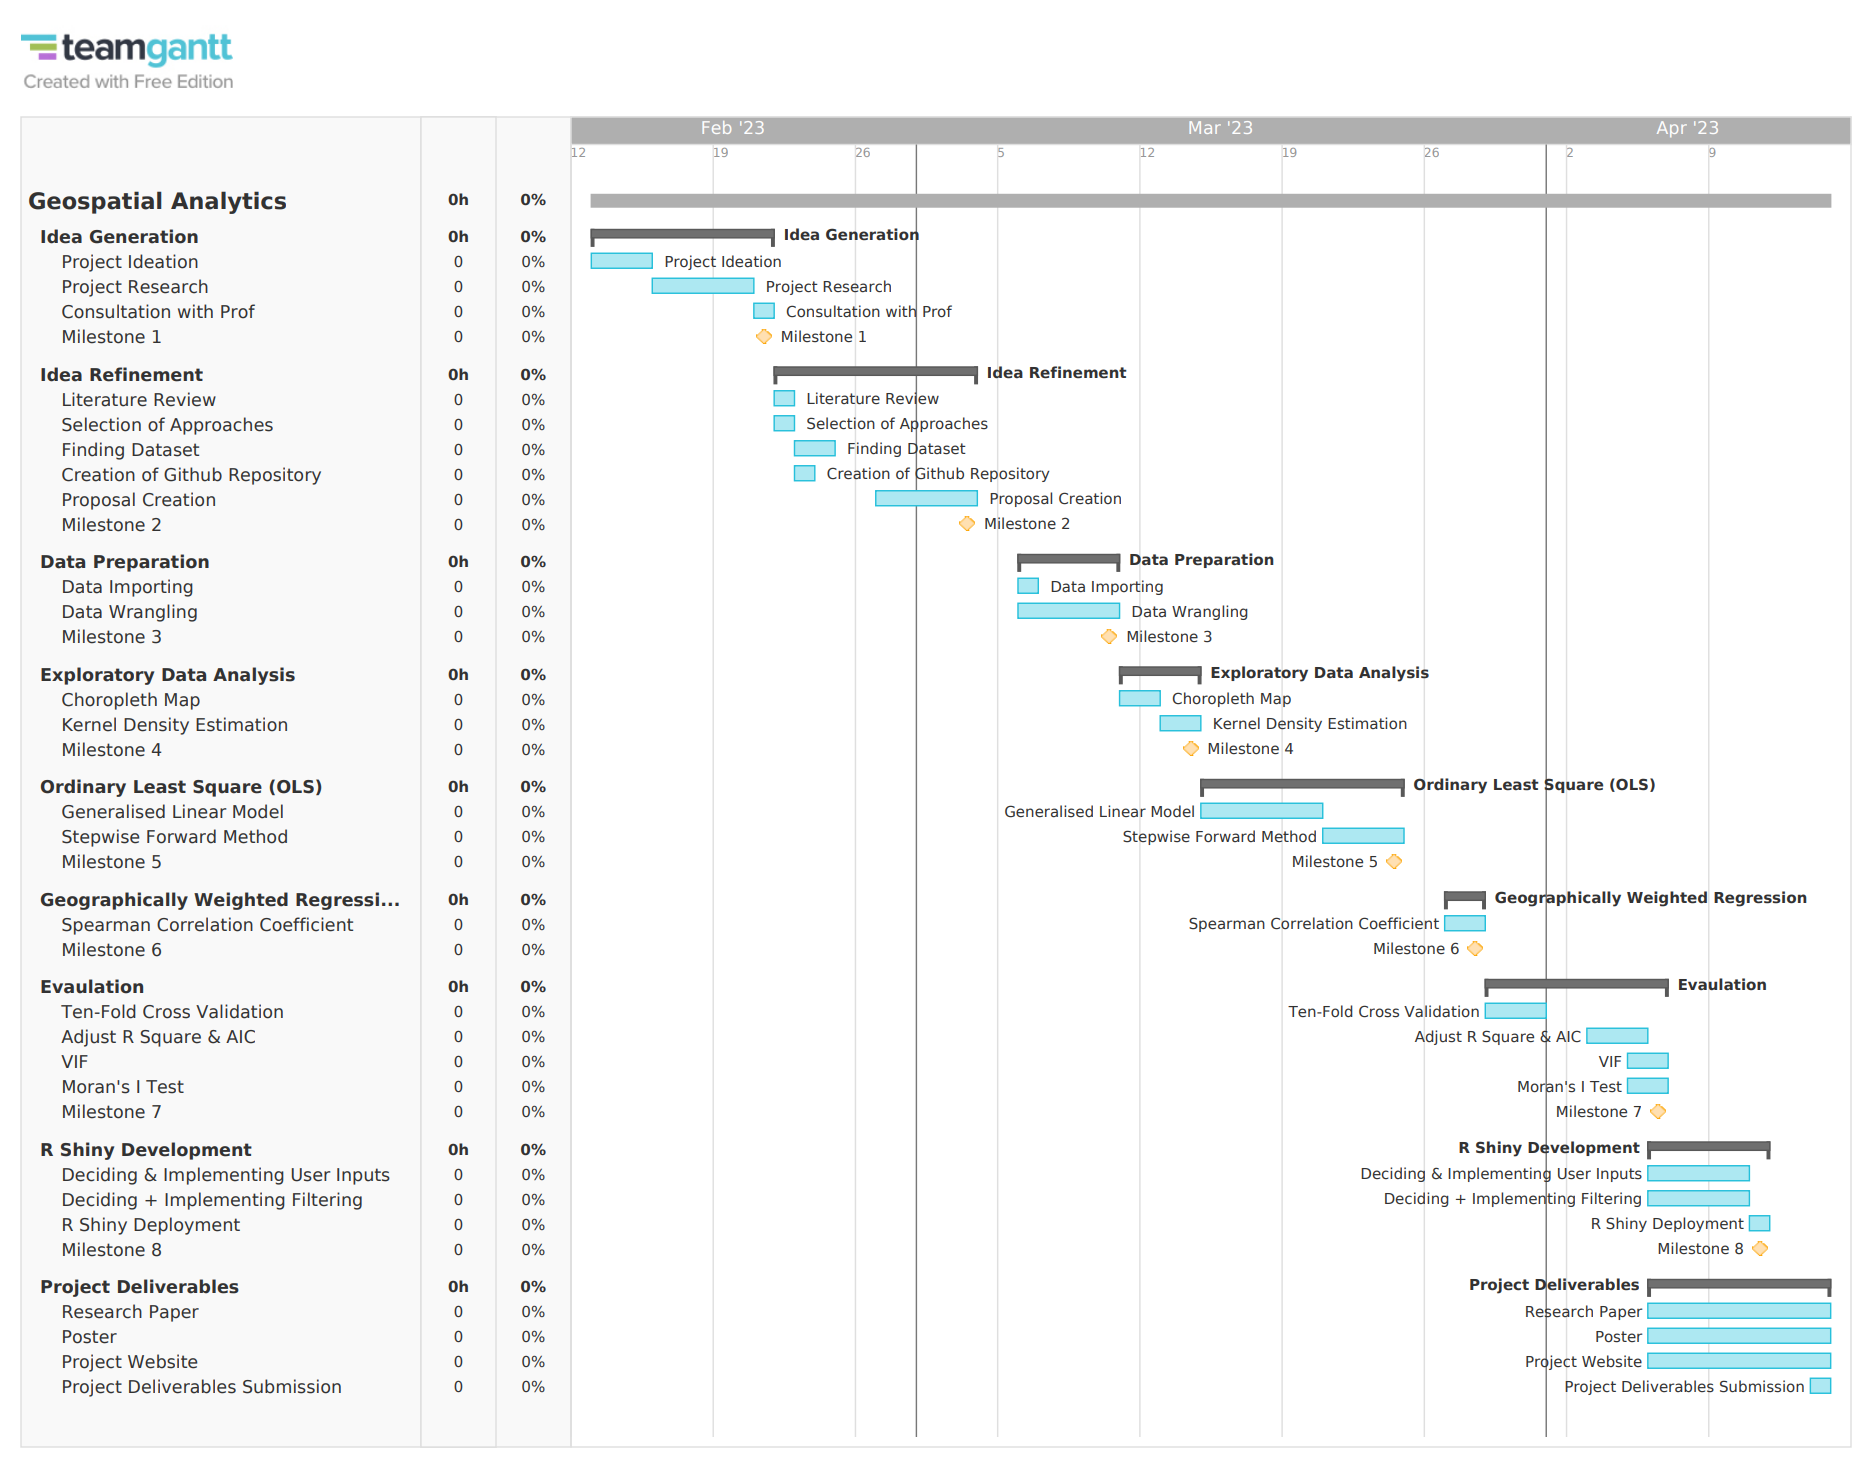 Credit to TeamGantt for their gantt chart template.
Mollalo, A., & Tatar, M. (2021). Spatial Modeling of COVID-19 Vaccine Hesitancy in the United States. International journal of environmental research and public health, 18(18), 9488. https://doi.org/10.3390/ijerph18189488
Ndiath, M. M., Cisse, B., Ndiaye, J. L., Gomis, J. F., Bathiery, O., Dia, A. T., Gaye, O., & Faye, B. (2015). Application of geographically-weighted regression analysis to assess risk factors for malaria hotspots in Keur Soce health and demographic surveillance site. Malaria journal, 14, 463. https://doi.org/10.1186/s12936-015-0976-9
Chengcheng, X., Jingya, Z., Liu, P. (2019). A geographically weighted regression approach to investigate the effects of traffic conditions and road characteristics on air pollutant emissions. Journal of Cleaner Production, Volume 239, 118084, ISSN 0959-6526, https://doi.org/10.1016/j.jclepro.2019.118084
| Name | |
|---|---|
| PENG YOU YUN | youyun.peng.2021@smu.edu.sg |
| HO YONG QUAN | yongquan.ho.2020@smu.edu.sg |
| S GUGANESH | guganeshs.2020@smu.edu.sg |